

Big data, Industry 4.0, machine learning, IoT – all are hot topics. Many pharma companies seem mesmerized by the concept that gold might be hidden in the depths of their own databases or the collectiveness of their production hall. And while it is likely true that useful results can be put together if data is used correctly, many pitfalls exist along the path towards these results.
Frank P. Ramsey proposed that the more data you have, the more spurious correlations you will be able to dig out and consequently the harder it will be to extract meaningful results. Paraphrased by Graham and Spencer back in 1990 as “Every large set of numbers, points or objects necessarily contains a highly regular pattern”. In short “more may actually be less”.
I am sure you too have stumbled across spurious correlations before and if not, you should visit tylervigen.com and get a laugh. Even though these correlations do not originate from “big data” per sé, they do occur as a result of having many data sources that eventually produce correlations with no obvious causation. A random example is shown below:
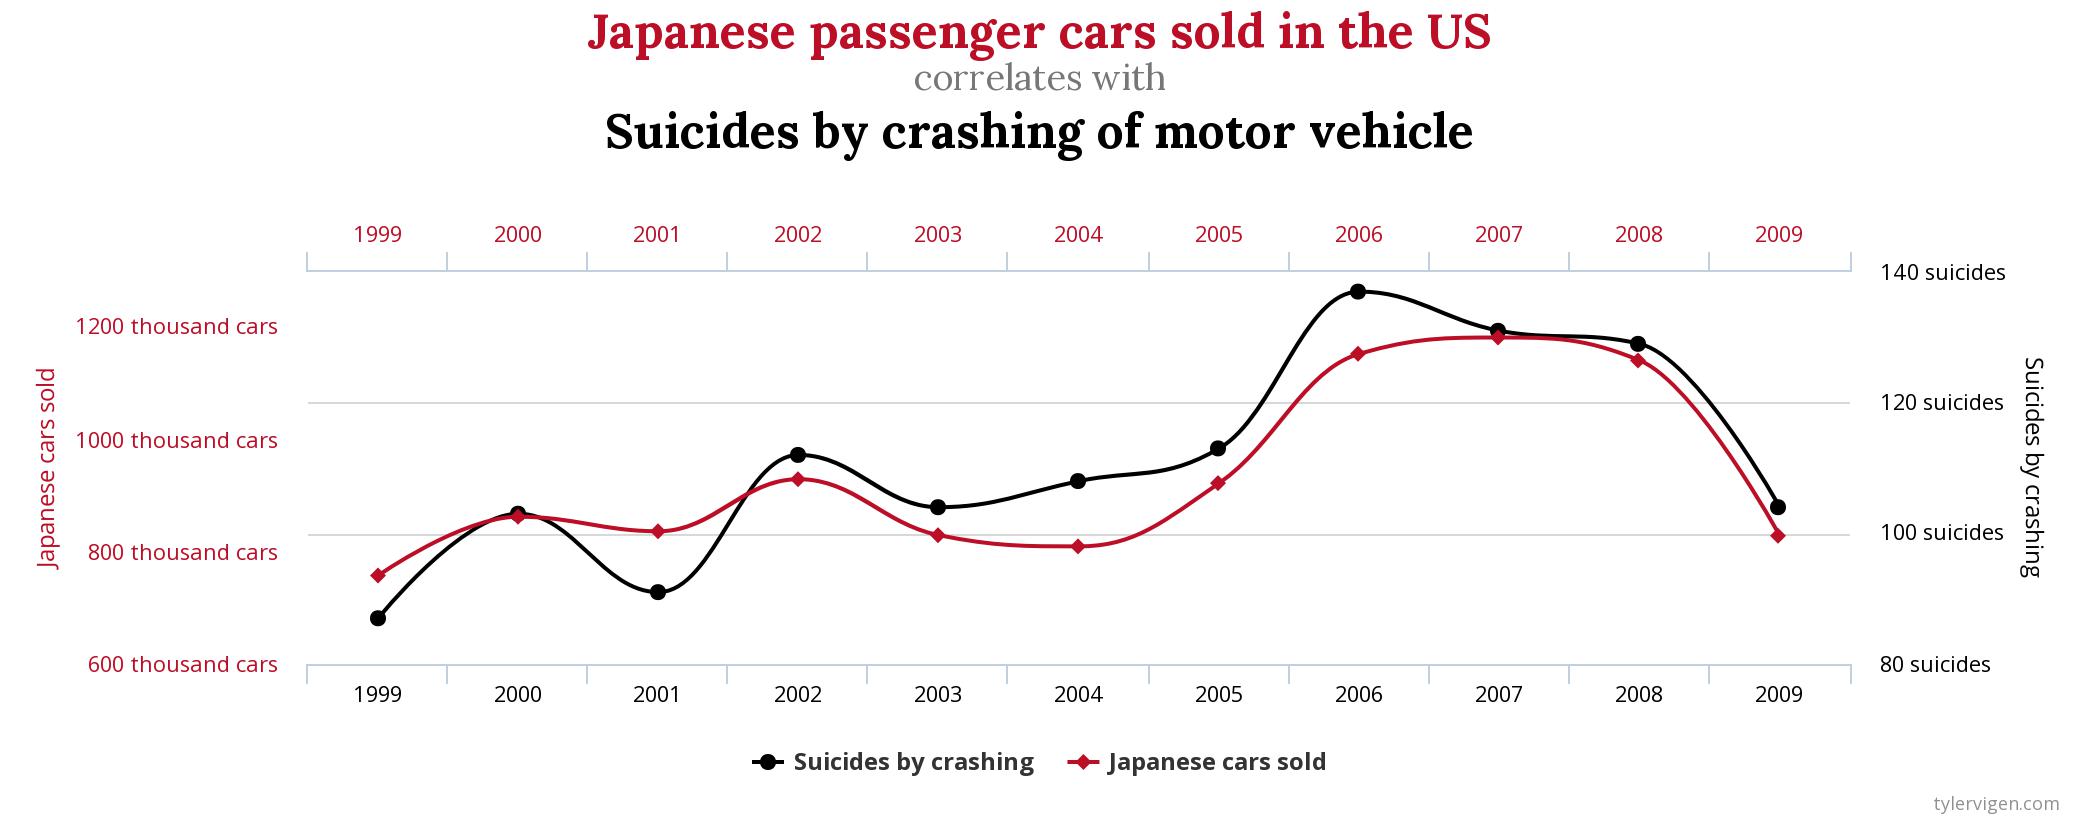
The above examples are obviously meaningless, but they do illustrate the danger of relying on coincidence when making predictive models. If these plots had been whipped up by some big data crunching algorithm fed with your own pile of production data, the spuriousness might not have been quite so obvious.
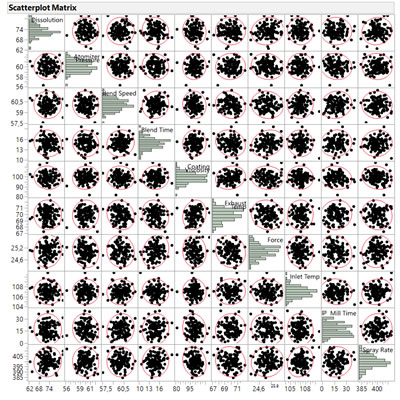
Consider this scenario: A tablet production process has a number of process parameters and process indicators constantly being logged and saved to a database. The process is stable and both process parameters, indicators, and critical quality attribute (CQA) show normal behavior. We wish to gain additional process understanding in order build a solid control strategy, but our initial exploratory analysis show no clear correlation patterns. The signal to noise ratio is too low to spot any significant trends and underlying interaction effects between factors are not revealed using this method.
George Box once claimed that if you want to know what happens if a factor changes you must actually change it, and with that in mind one could look towards Design of Experiments (DoE). In the current example, this could involve gathering your subject matter experts for a DoE workshop to identify which factors to vary, by how much, and which process indicators to monitor based on their expert experience.
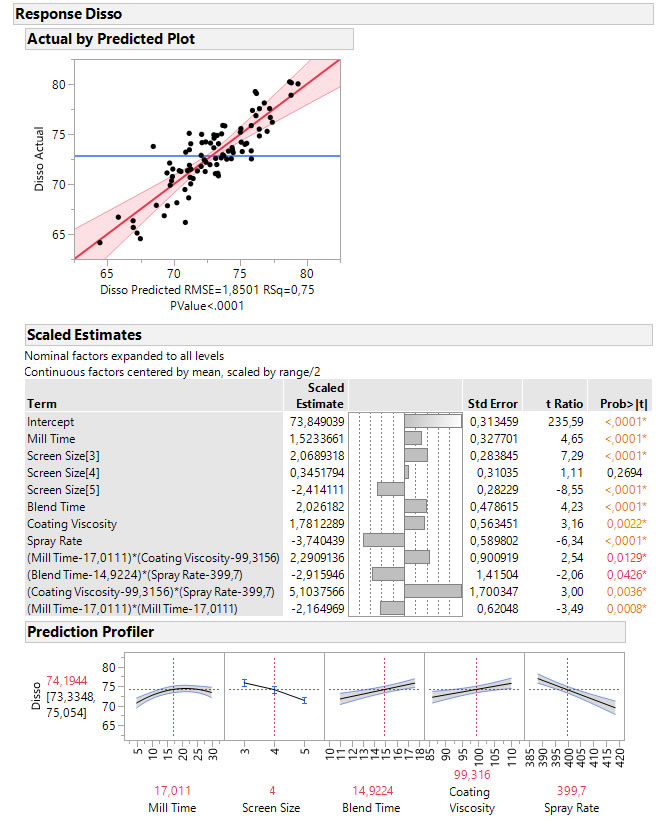 In this example, the final prediction model built on the data collected during the DoE reveals a number of significant control factors and process indicators that can be used to predict the CQA and support the control strategy. As the model shows, quite a few of the significant model terms interact. This means that the significance of one factor is dependent on the setting of another. This kind of effect is not revealed in the correlation plot shown previously.
A data-based control strategy can be expanded to support inline release and continuous process verification (CPV) by defining requirements for the process indicators that will guarantee sufficient capability of the CQA. In the current example “coating viscosity” can be used as a process indicator for the CQA (“dissolution”), where the remaining four significant process variables can be used to control the CQA.
The DoE method is just one of several that can be used to supplement the big data approach. Big data isn’t necessarily the answer to everything and instead of rushing towards aggregating as much data as possible and praying new answers present themselves by magic, one might deploy a more critical approach to data collection and data modelling.
When initiating projects involving big data, the advice will hence be: Set your expectations realistically, use a great deal of common sense when interpreting the results, acknowledge the limitations your data might have, and be prepared to perform experiments to gather new data.